
I’m a research advisor at the Planétarium Rio Tinto Alcan of Espace pour la vie, and I’ll use this page to keep you updated with some of our original research. I recently completed the study of a young association of stars named μ Tau. This study was just published in The Astrophysical Journal. I will take this opportunity to tell you about this association of stars, how we were able to determine its age, and what new avenues of research this discovery is opening up.
This blog post is also available in French here.
It is about two years ago that we started up this project, when a collaborator brought a very interesting set of stars to my attention during an email exchange. This collaborator is Eric Mamajek, and he is a researcher in astrophysics at the Jet Propulsion Laboratory, in California. He is probably one of the experts that best knows the scientific literature about young stars in the solar neighborhood. Several years ago, he had noticed that a bright star named μ (the Greek letter “mu”) of the Taurus constellation (Latin for “the Bull”)—this star is also called μ Tau for short—seemed to move on the sky in a way that is similar to a small number of other stars. He showed this to me with this figure that he made:
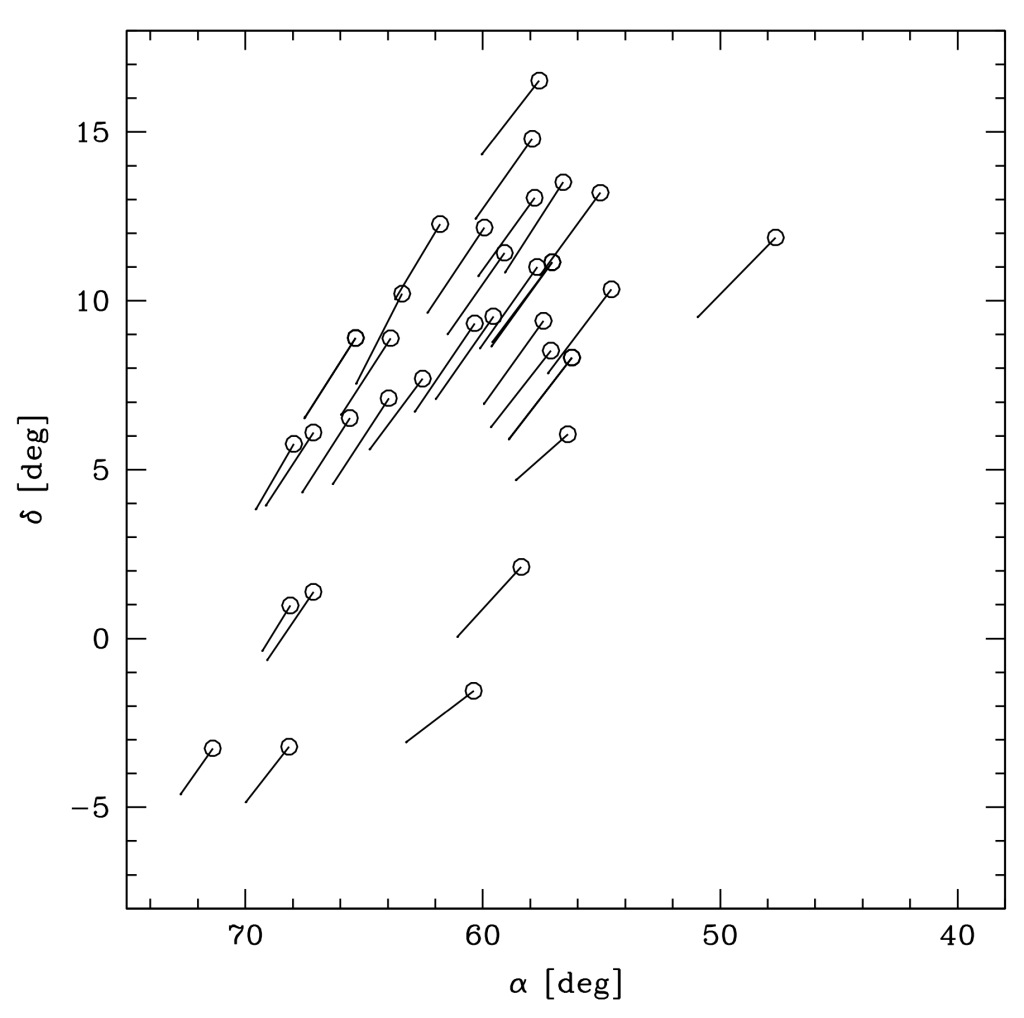
In the figure above, each circle represents the position of a star on the sky, and each line represents the direction in which the star is moving over time. This lateral motion of stars on the sky is called proper motion. The horizontal location of each star on this chart indicates its right ascension, which we designate with the Greek letter alpha (α). The vertical location represents its declination, designated with the Greek letter delta (𝛿). The right ascension and declination of a star represent its coordinates on the sky, and they are a bit analogous to how we use longitude and latitude to represent the position of an object on the surface of the Earth. Both systems of coordinates are even aligned with each other; right ascension and declination are a lot like longitude and latitude, but projected outwards on the sky. There is just a slight difference: because the Earth rotates, the grid of longitudes rotates a full turn every day with respect to the grid of right ascensions.
We can therefore think of the figure above as a small fragment of the full map of the sky, showing a group of stars that move together. The stars displayed on it move very slowly: we would need to wait about 350,000 years for the stars to reach the tip of their respective straight lines. However, high-precision instruments allow us to measure such small displacements after a few years only!
The size of the map shown above is about as large as the Big Dipper asterism. The size that this ensemble of stars spans on the sky becomes more obvious if we display them on a true map of the sky: they cover a large part of the Taurus constellation, and they even cross over parts of Aries (to the right) and Eridanus (at the bottom).

If you have already seen my first blog post, you might have an intuition of why these stars are all moving together. They may represent the tip of the iceberg of a young stellar association, with hundreds of fainter stars that also move in the same way. Stellar associations are groups of stars that were born together from the same molecular cloud. They are similar to open clusters, but some of them contain a much smaller number of stars, and may be fragments that detached from an open cluster, or simply a small cluster that is slowly dissipating. This tends to happen over time as some of its stars get torn apart by the gravitational attraction of other clusters or massive stars on its path around the Milky Way.
These young associations are of great value to astrophysicists, because they provide us with a set of stars that are all of the same age. This makes it much easier to characterize these stars, because it is extremely hard to measure the age of an individual star in isolation. Most of the stars in a young association only give us subtle hints on how old they may be, and it is only when we combine all of these hints together, over hundreds of stars, that we can determine a precise age for the whole association. If we are lucky, we might even find rare types of stars in the association that allow us to determine their age precisely. When this happens, the improved accuracy of our age estimation is reflected on all other stars in the association!
At the time when Eric found this potential new association of stars, we did not have enough data to reconstruct the velocity of each individual star in three dimensions—this requires a measurement of each star’s distance, and how fast they are moving towards or away from us, which we call the radial velocity. Reconstructing these 3D velocities would thus have required that researchers observe each star individually with specialized instruments at the telescope, during dozens of nights spread out over several years. This set of co-moving stars therefore remained quite obscure for years, without anyone else noticing them.
When Eric sent me this list in 2018, the situation was completely different. The first data set of the Gaia mission had recently been released by the European Space Agency (ESA). This data set contained extremely precise measurements of distance and proper motions for more than a billion stars, on top of radial velocity measurements for the million brighter stars. These data are revolutionizing our understanding of the galactic neighborhood, by giving us a 3D view of the positions and velocities of many nearby stars. The list of stars assembled by Eric, when viewed in 3D with the help of Gaia data, seemed consistent with his starting hypothesis that we may have been looking at a new association of stars.
At that point, I decided to start looking for additional faint members in this putative new association. To do this, I built a 3D model to represent how the positions and velocities of Eric’s stars are distributed in the Galaxy. During my postdoctoral fellowship at the Carnegie Institution for Science, I built a set of computer codes, named BANYAN Σ (Σ is the capitalized Greek letter ”sigma”). This computer tool uses a model of average position and velocity to identify new stars with similar motions. The power of this tool resides in its ability to identify even the stars for which we do not have all measurements required to build their 3D positions and velocities. This allows us, for example, to recover the members of a stellar association that are too faint for Gaia to have measured their radial velocity. We may know their lateral motion on the sky (proper motion), but not their velocity towards us, preventing us from reconstructing their 3D motion. BANYAN Σ uses the magic of statistics to predict which stars will have the right 3D velocity to match a stellar association!
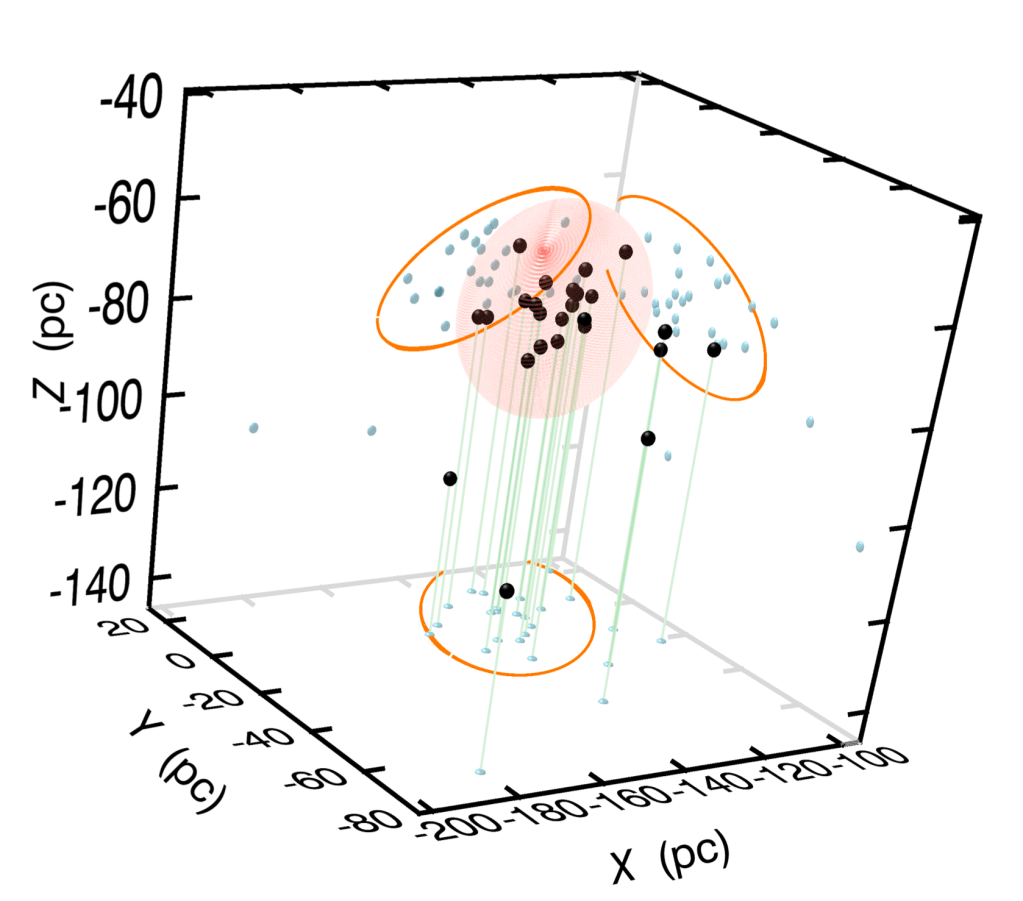
The figure above shows the position of stars in Eric’s list along three Cartesian directions , X, Y and Z, which we also call galactic positions. In this coordinate system, the Sun is located at X = 0, Y = 0 and Z = 0 by definition. The positive values of X point towards the Galactic center, those in Y point towards the direction of rotation of stars around the Galaxy (clockwise). The Z coordinate takes positive values above the Galactic plane, and vice versa.
The 3D velocity of a star can also be described in a similar coordinate system. We call this the space velocity of a star; its components U, V and W indicate the rate at which its respective X, Y and Z Galactic positions are changing over time.
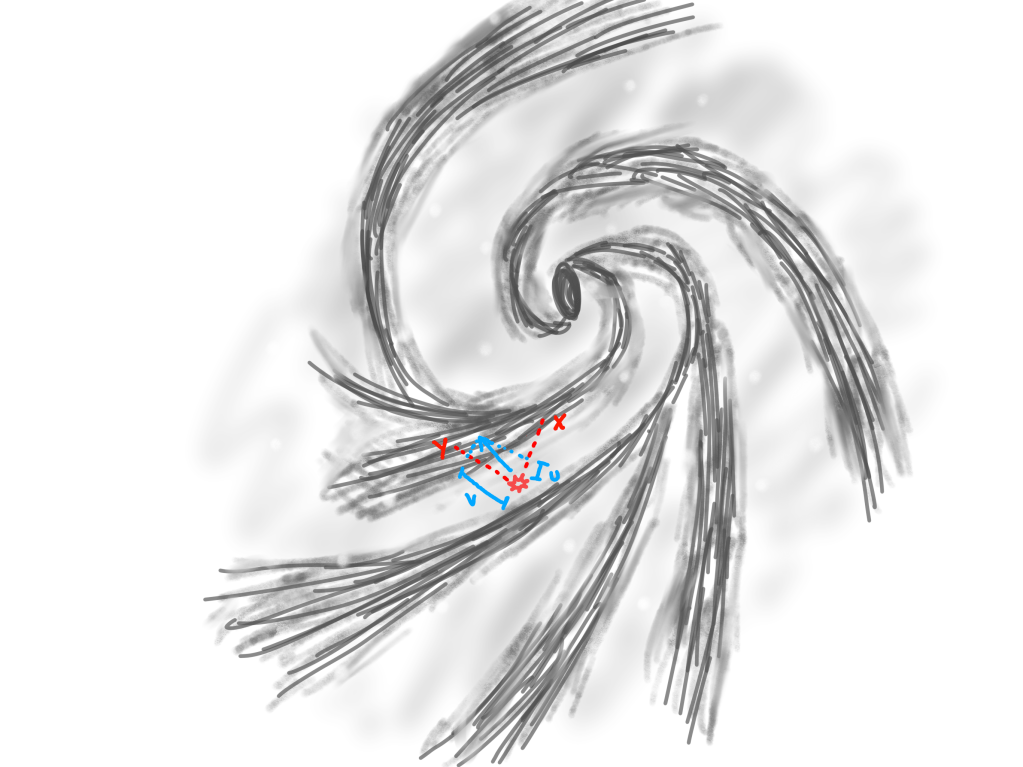
plane of the Galaxy (W = 0), with a small U component and a large V component.
Eric’s list of stars can be represented in this system of XYZ Galactic positions, and their 3D velocities can also be calculated as UVW space velocities. To calculate XYZ, we need to measure their position on the sky and their distance, but to calculate UVW we also need to know their proper motion and radial velocity.

As you can see in the drawing above, Eric’s stars have similar XYZ positions and UVW velocities. This is one of the most obvious characteristics of stars that belong in a young association: they all formed from the same molecular cloud, and they will all keep moving like their parent cloud for a few hundred million years (I explain this more in this post).
Stars that are very faint are usually the most difficult members of a stellar association to identify. This by how difficult it is to measure their radial velocity: we need to observe them with long camera exposures, using a very large telescope. Because of this, can’t simply calculate their UVW velocities and compare them to those of the known stars that make up a stellar association. We usually know two components of their velocity from their proper motion (which has two components), tangential to the sky. However, these two tangential directions are usually not aligned with the UVW axes. Even worse, the misalignment between proper motions and UVW velocities changes depending on the direction where a star is located. This makes it much harder to compare the velocities of two stars that are far apart in the sky. This comparison is the main goal of BANYAN Σ, the mathematical tool which I built. It uses a statistical approach to determine the probability that a star has the same UVW velocities as known stellar associations, even if we know only its proper motion.
Once I have built a 3D model of how Eric’s stars are distributed in XYZ and UVW, I used the kinematic properties of all 1 billion stars in Gaia—including stars without radial velocity measurements—and I calculated the probability that they share similar UVW velocities to Eric’s list of stars. This allowed me to build a list of 500 new stars that had a high probability of moving in a similar way to Eric’s stars. I then dug up dozens of scientific publications and databases to verify their properties in detail.
This allowed our team to identify a set of 392 additional stars with properties that are consistent with a single population of the same age, and with similar XYZ positions and UVW velocities. We had thus recovered what really seems to be a new young association of stars! We named it the “μ Tau association” after one of its brightest members, as we usually do when we identify a new association.
If we place all of these stars in the μ Tau association on a map of the sky, it becomes more obvious how Eric’s list of stars was really just the tip of the iceberg!

One important tool to determine the age of a young association is what we call the color-magnitude diagram. The horizontal axis of this diagram shows the color of a star, and its vertical axis shows its intrinsic brightness. The intrinsic brightness of a star can be expressed as an absolute magnitude, which corresponds to the magnitude of a star if we placed it at 32.6 light years from us. Here, I will use the terms color-magnitude diagram and brightness specifically in reference to this intrinsic brightness.
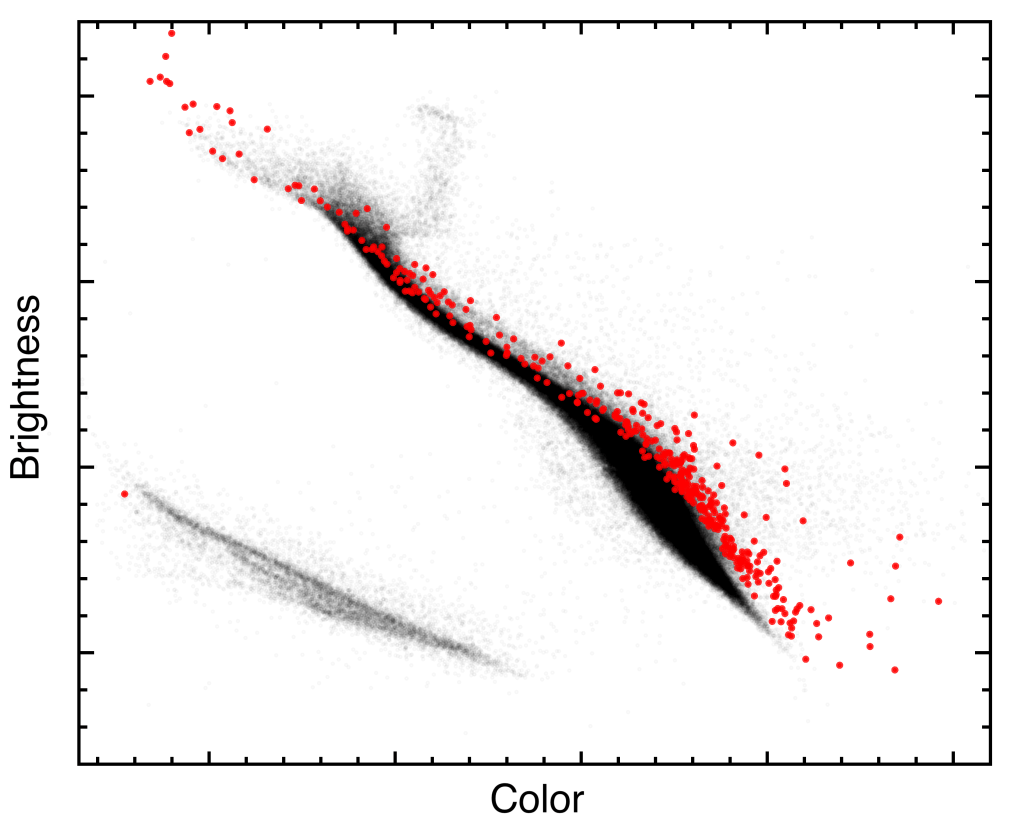
The bluer stars are located to the left in the figure above, and stars that look red are located to the right. The brighter stars are located higher up, and vice versa. Black dots show the properties of all stars in the solar neighborhood, and red circles represent stars that belong to the μ Tau association. The bluer stars (to the left) tend to be brighter (higher up on the diagram); this is due to the fact that massive, bright stars appear bluer because of their hotter temperatures. Stars with lower masses are fainter, but also cooler; this gives them a redder color, and they are thus located to the lower right of the color-magnitude diagram. The horizontals position of stars in this diagram is thus an indication of their temperatures: cooler stars are located further to the right. If you are paying close attention, you might have noticed a few differences between the black dots (all stars in our neighborhood) and red circles (stars of the μ Tau association). For example, the low-mass stars of the μ Tau association seem brighter than those of the neighborhood that have the same horizontal position in the color-magnitude diagram.
This is a well-known property of young stars with low masses: during the few hundred million years that follow their birth, they slowly contract until they reach their final size, which they will keep for billions of years. When we catch them during their young age, they will appear brighter to us because they are still physically larger!
In the case of massive stars (at the upper left of the color-magnitude diagram), this trend reverses. These stars contract very fast after their birth, and they live much shorter lives overall. It is for that reason that there are very few stars of our neighborhood (black dots) at the upper left of the figure. In fact, the more massive a star is, the shorter its life will be. For example, the stars with a mass above 8 times that of the Sun only live for a few million years before they burst into a supernova, and give birth to a neutron star. Stars with about 3 times the mass of the Sun will live for about 300 million years, and then become red giants. When a star becomes a red giant, it puffs up and becomes much larger and cooler. You might have guessed it: when a star reaches its red giant phase, it moves up and to the right in the color-magnitude diagram. After a few more hundred million years, the outer layers of the red giant star will be completely ejected into space, and become a planetary nebula. At the center of this nebula, the core of the former red giant star will still be intact: we call this remnant of the star’s core a white dwarf.

If we go back once again to the color-magnitude diagram that shows all stars of the μ Tau association, you might notice that it includes several stars which are very bright, which we only rarely find in our galactic neighborhood. The most massive of those is called 29 Tau, and it is about 5.4 times more massive than the Sun. We know that these stars only live for 80 million years, and this is a clear indication that the μ Tau association has to be quite young.

By comparing the color-magnitude position of all stars in the μ Tau association with those of other associations with known ages, we were able to estimate that the age of the μ Tau association is between 55 and 70 million years. When we do this, it is important to remember that the massive stars that belong to μ Tau are currently in a phase of their stellar life that is a lot more advanced than its stars of lower masses.
One very interesting discovery we have made while studying this young association is that one of its stars has even already died! A white dwarf named WD 0340+103 is moving in space very similarly to the μ Tau association. It is a very unique white dwarf, because it is still extremely hot, and its properties indicate that it comes from a massive star (6.7 times more massive than the Sun), and that it went through its planetary nebula phase only 270,000 years ago! This might seem like a large number, but it represents a time scale so short that we rarely ever encounter it in astrophysics. This discovery was very exciting for us, because physics-based computer models built right here at the University of Montreal allowed us to determine that the star which died and gave birth to WD 0340+103 was itself born about 60 million years ago—right within the age range we had estimated for the μ Tau association!

This new association of stars will be of great use to researchers in astrophysics, especially so because we currently know very few examples of stellar populations with ages between 50 and 100 million years near us! Searching for exoplanets around the stars that belong in the μ Tau association will be very interesting, because this will allow us to see what the properties of exoplanets are at this specific age after their birth. This is something we can only rarely do, because we do not know the precise age of most exoplanet systems. By comparing the properties of exoplanets in the μ Tau association to those of others young associations—for example the β Pictoris association with its 24 million years of age, or the 110-million-years-old Pleiades association—, we will better understand how their atmospheres change over time, and how they might migrate onto different orbits around their star.
The study of the magnetic activity of stars as they age will also allow us to better understand the habitability of rocky exoplanets in orbit around them. We think that low-mass stars may have rocky exoplanets with the right surface temperatures for liquid water when they are in tight orbit around their star, which could allow life as we know it to exist. However, this close separation to their host star also means that these exoplanets would be withstanding incredible amounts of UV and X-ray radiation, especially when the star is young, that life as we know it would undergo mutations too quickly to survive for long.
There is also a whole other project that I am excited to begin working on, now that we found this new association. We can use it to look for “free-floating” exoplanets, which are wandering alone in space instead of in orbit around a star! The reasons why we need young associations to discover these rare objects are complex, and will be the subject of a future blog post!
I would like to thank Marc Jobin and André Grandchamps for comments and figure contributions.

2 thoughts on “The μ Tau Association of Stars”